-
 Blog
Blog
-
Drill Down in Teamscale's Metric Trend Charts

In this blog post I’d like to highlight a small yet very handy feature of Teamscale’s metric trend charts that assists you in effectively finding the root cause for conspicuous changes of quality in the history of your code base.
Teamscale’s metric trends allow you to inspect how your source code evolved with regards to different quality criteria. With its incremental analysis engine, Teamscale analyses the effects of every single commit on the quality metrics and thereby providing detailed trend information. For instance, to analyze how the amount of copy and paste programming changed, you can easily bring up a trend chart for the clone coverage by clicking on the respective metric value in the metrics perspective.
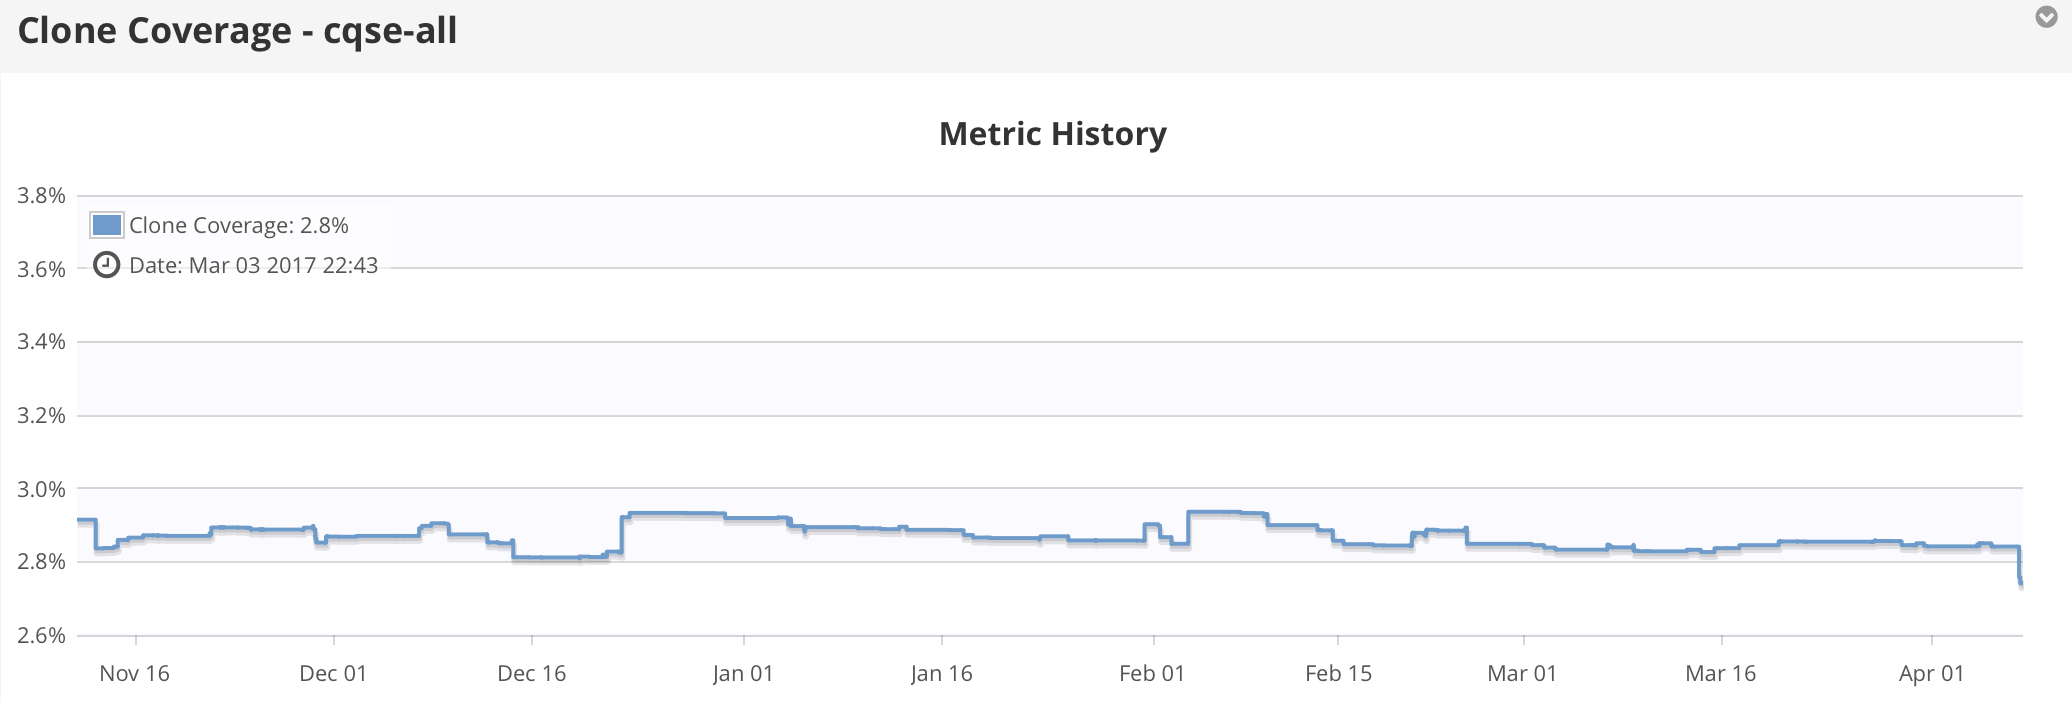
Looking at such a trend, it’s easy to spot significant decays or increases. Given such a peculiarity in the trend, the instant question arises: »What caused this?« The metric trend chart provides an easy way to answer this question within seconds. By dragging with the mouse, you can zoom into the trend and focus on a smaller time range containing the change if interest.
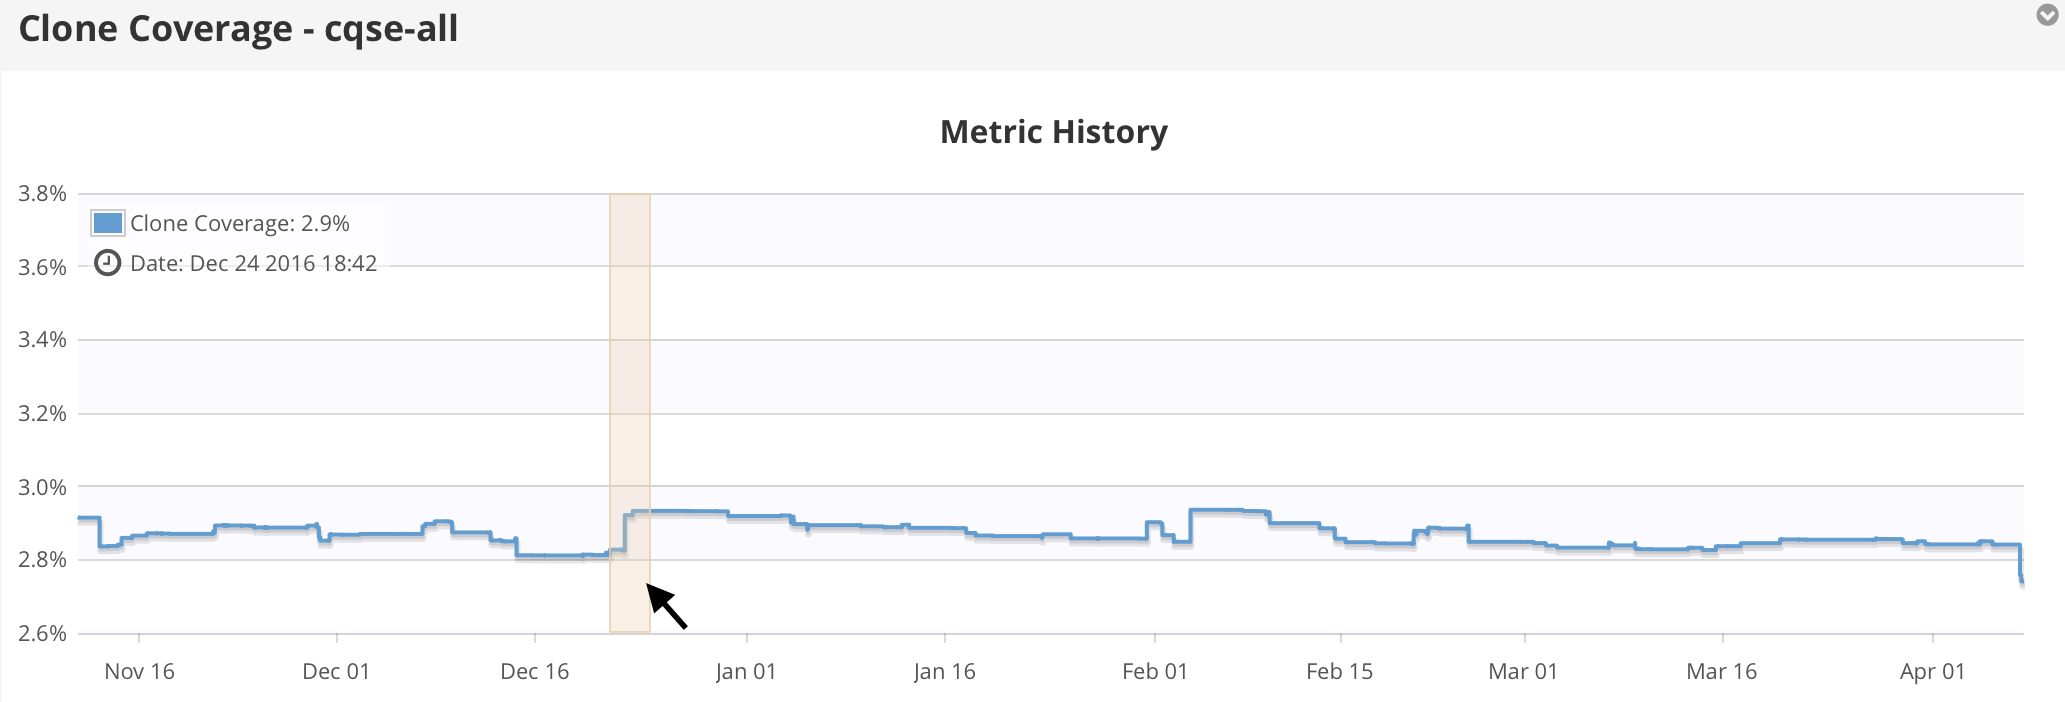
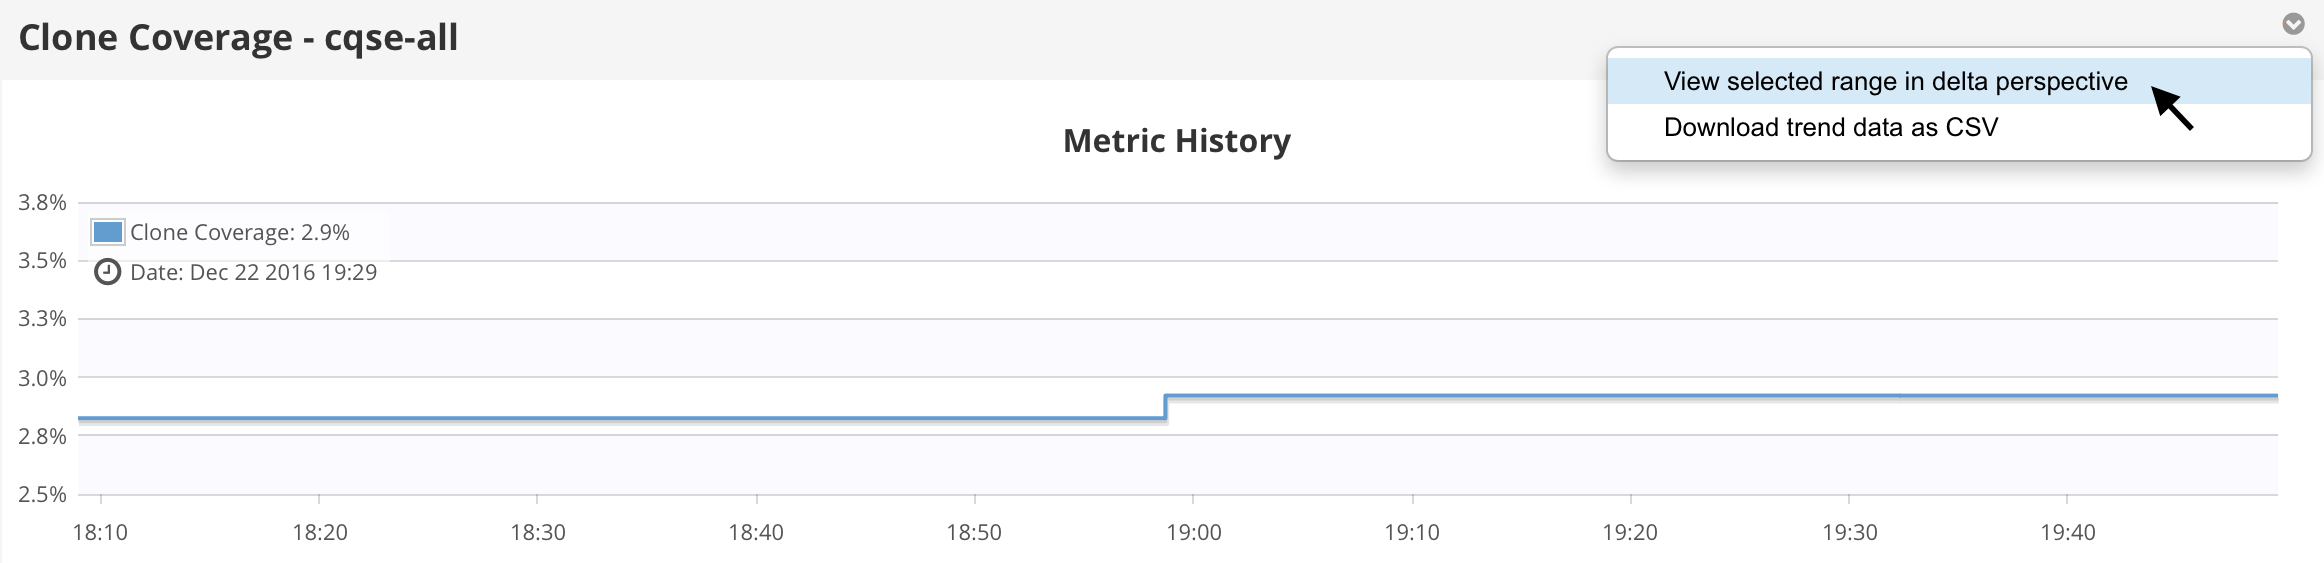
By repeatedly doing so, you can narrow down the time range to days or even hours. You can see the currently selected time range by looking at the scale the of x-axis. You can then automatically perform a delta analysis for this interval by opening the dropdown menu in the upper right corner and selecting »View selected range in delta perspective«.
As described in an earlier post, the delta analysis will compare two snapshots of the code base and analyze the commits to the version control system that occured in a given time range. As we narrowed down the time interval, we expect only few changes to be shown. Consequently, we can now easily spot the commit(s) causing the change in the metric trend.
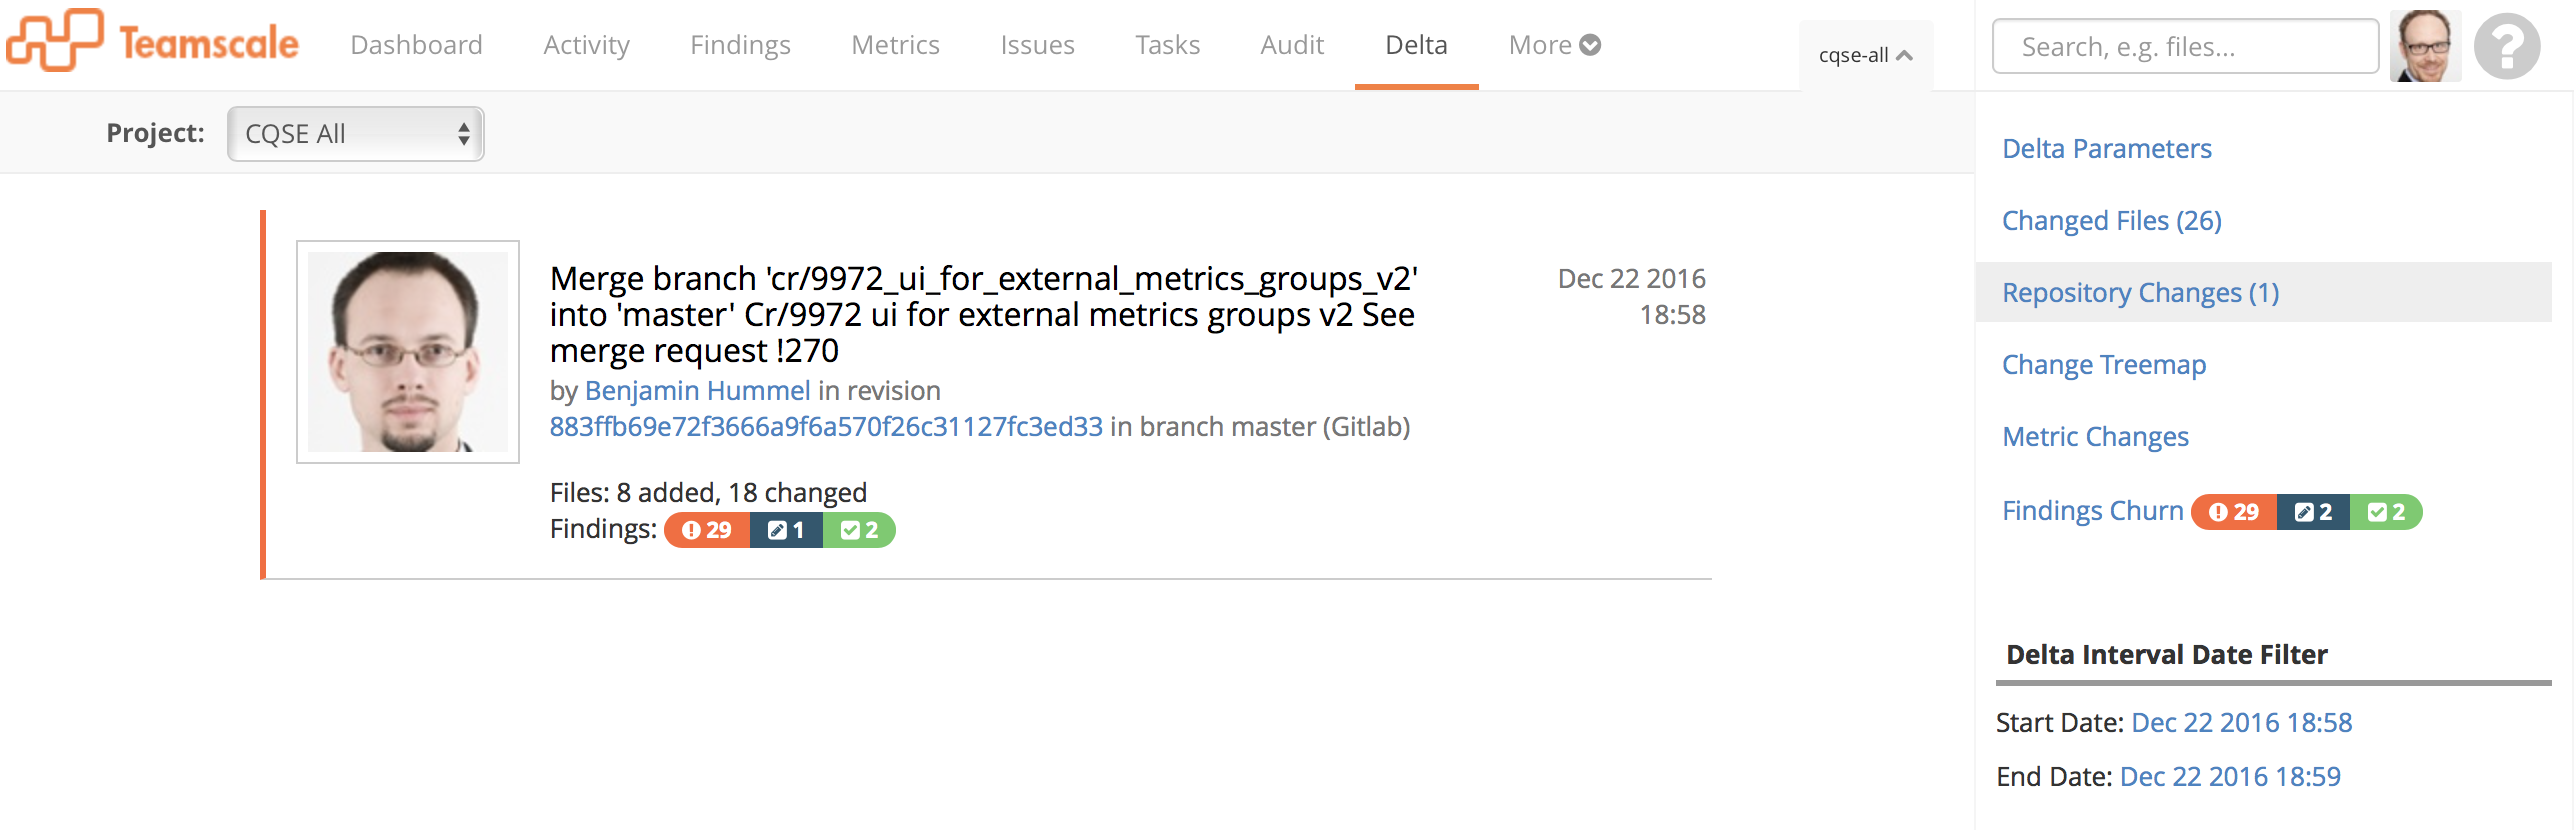
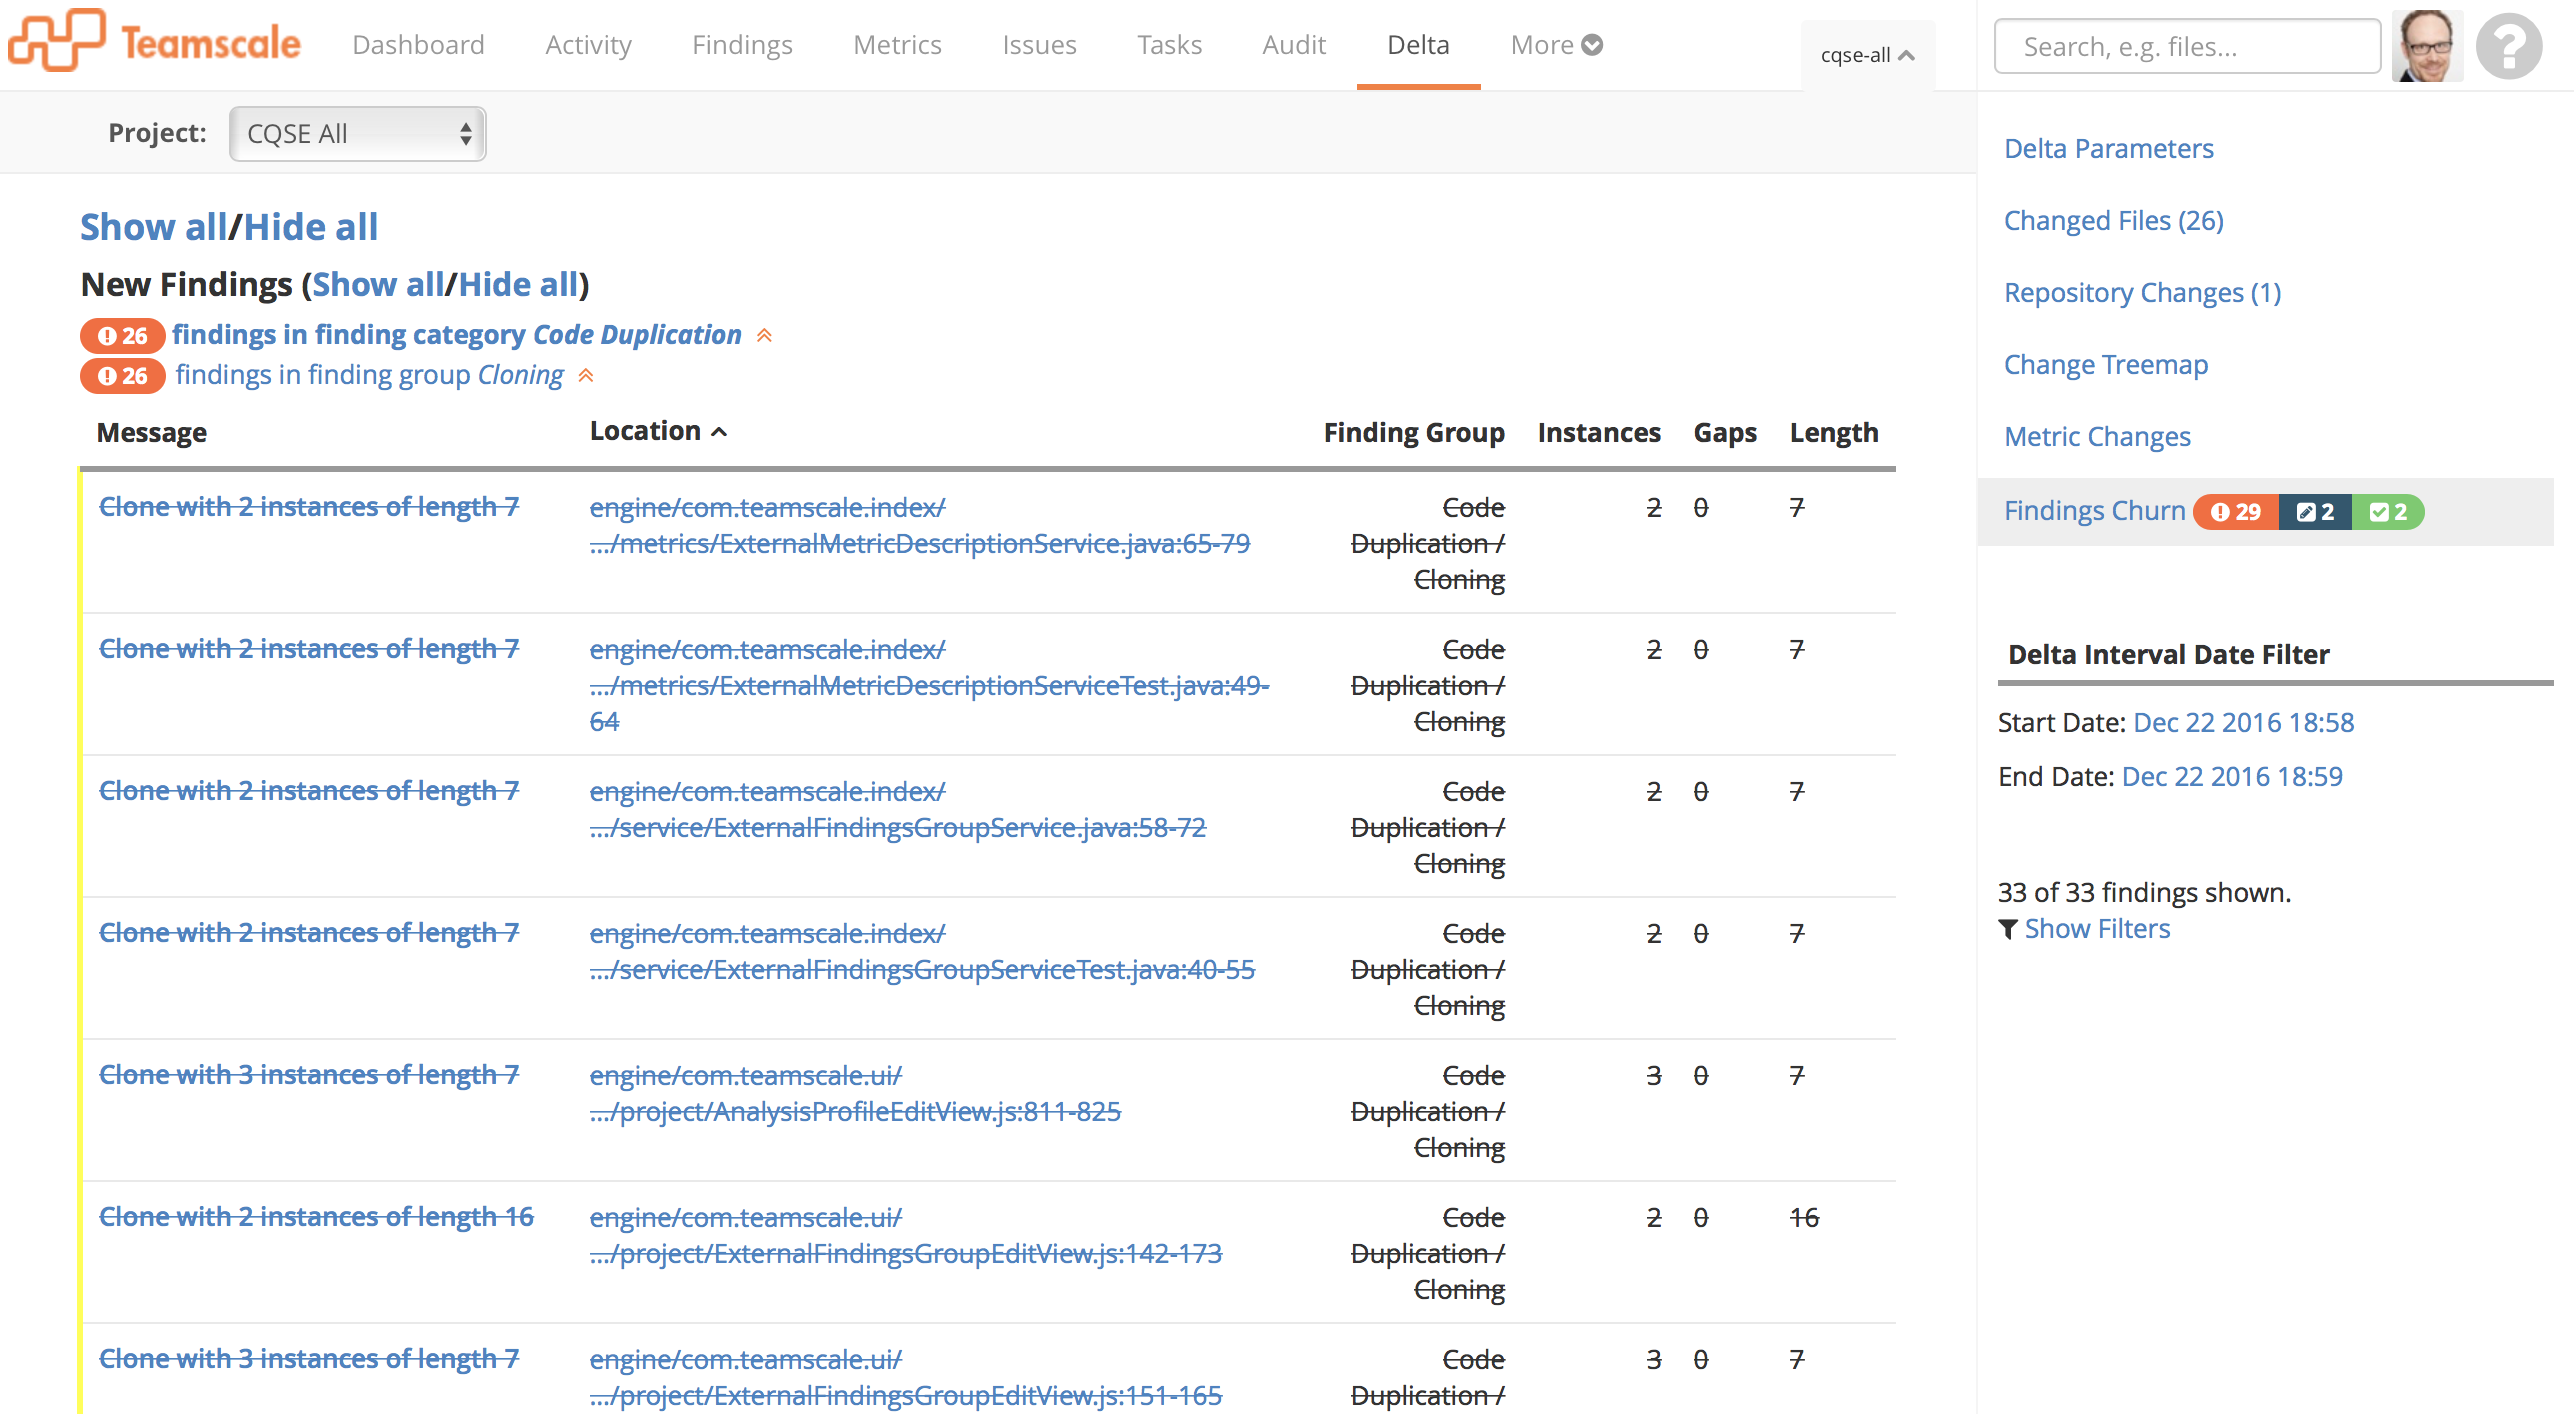
At this point it should be noted that such a root cause analysis is not about pointing fingers but rather about getting insights into the evolution of your code. In the example scenario, clicking on the findings churn tab reveals that parts of the clones introduced with the change have been removed by a later cleanup (as indicated by the crossed out findings in the list).
In sum, Teamscale allows you to quickly pinpoint reasons for metric changes and thereby enabling you to make informed decisions for sustainable software quality control.