-
 Blog
Blog
-
Bugs Chained: How to Apply Thresholds to Issue ...

The issue metrics are an exciting feature of Teamscale. They allow you to analyze and visualize issues (a.k.a. tickets) of an issue tracker using a query language. Benjamin presented this feature in a previous blog post.
In this post, I will show how issue metrics can be used in threshold configurations to assess the number of critical bugs. Threshold configurations define thresholds for a set of metrics and are applied by Teamscale to automatically compute ratings for the current metric values of a project. The blog post on threshold configurations gives an introduction into this feature.
Combining issue metrics and threshold configurations renders it possible to get an overview of the trend of issue metrics of a project. Furthermore, it is possible to present the trend chart with its corresponding yellow and red threshold, whose value may depend on the point of time.
Show overview of issue metrics
I will explain how you can create a threshold configuration with issue metrics to assess the number of critical bugs. First, we need to create an issue metric in the issues perspective. Auto-complete will help you to define the query; refer to the issue-metrics blog post or the user guide for further information about the query language. After submitting the query, the matching tickets are listed and we can create an identifier for the metric from the query (see Figure 1). We will need this identifier later on to reference the metric.
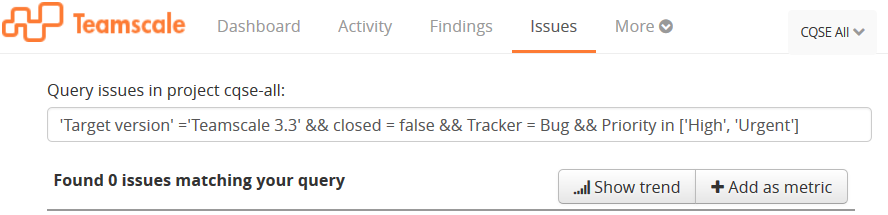
Figure 1: Issue query
Next, we switch to the Projects perspective, open the Thresholds view, and create a new Threshold Configuration. We specify a name for the configuration, add a group, and add a metric to the group. In the metric selection dialog, we select »[Issues] Issue«. We want to create a metric for the number of critical bugs, therefore, we specify that low metric values are good (see Figure 2).
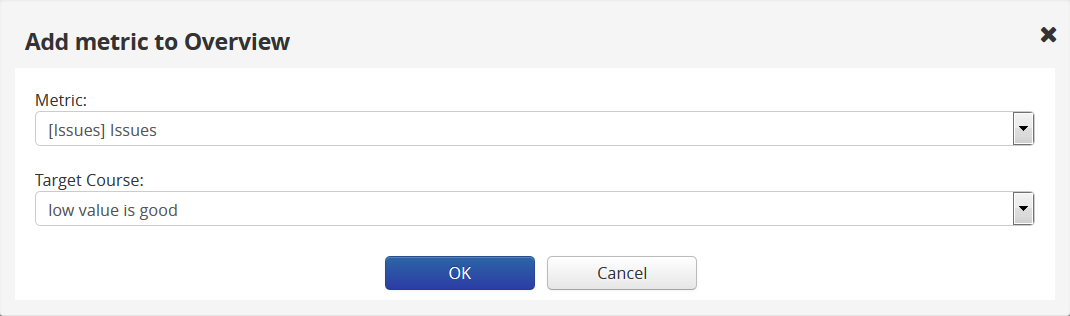
Figure 2: Add an issue metric to the configuration
Next, we fill »Critical Bugs« into the custom name field, which specifies the display name to be shown for this metric. Then, we specify the issue-metric identifier, which references the previously created metric, in the sub path field. Furthermore, we define threshold values. We specify 50 as yellow and 80 as red threshold such that the metric will be rated as red if the number of critical bugs exceeds 80, as yellow if it is between 50 and 80, and as green if it is below 50 (see Figure 3). Then, we save the threshold configuration.
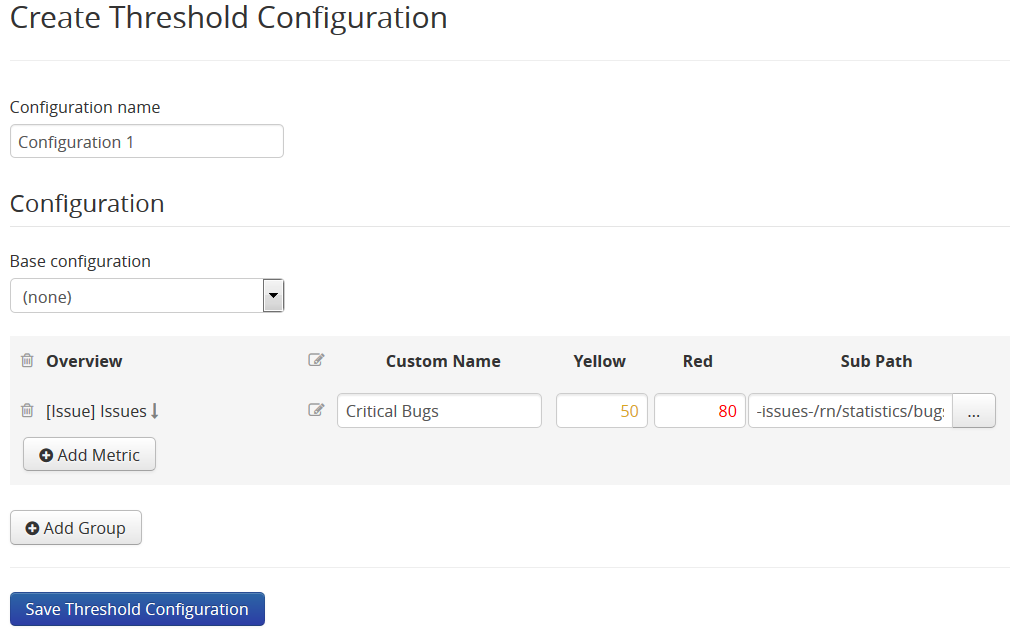
Figure 3: Metric Threshold Configuration
Use of dynamic thresholds
Let’s say that we don’t want to have constant threshold values. We want to allow a higher number of open critical bugs at the beginning of the development phase, however, the number should decrease the closer we get to the release date. Therefore, we create further threshold configurations that specify lower threshold values for this metric. Note that it is possible to inherit from a threshold configuration, such that you don’t have to create each configuration from scratch. Instead you can reuse a base configuration and override the threshold values.
As next step, we open the project options and specify which configuration shall be valid in which time span. We can simply add threshold configurations and specify their start date (see Figure 4). Each configuration will be valid until the start date of the next configuration. Note that the specified threshold values are valid for the day of the start date; the values for the time span between two configurations are computed using a linear function.
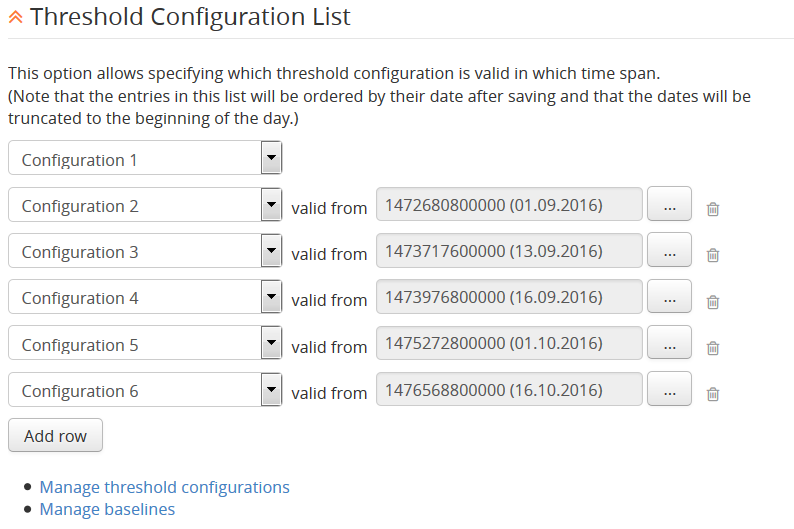
Figure 4: Threshold Configurations and their validity time-span
Now, let’s create a new dashboard and add the Metrics Table widget (see Figure 5). It will show all specified metrics and their rating according to the currently valid threshold configuration (as configured in the project options). In the widget options, we activate »Show rating« and »Show trend« to display the according icons. A click on the trend icon presents the trend chart of the metric with the thresholds in the background. The thresholds can also be directly displayed in the Metrics Trend Chart widget (see Figure 6) by activating »Show thresholds« in its options.
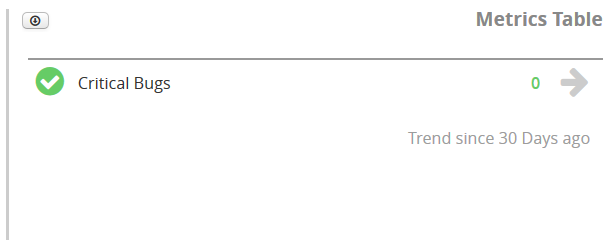
Figure 5: Metrics Table widget with rating and trend icon
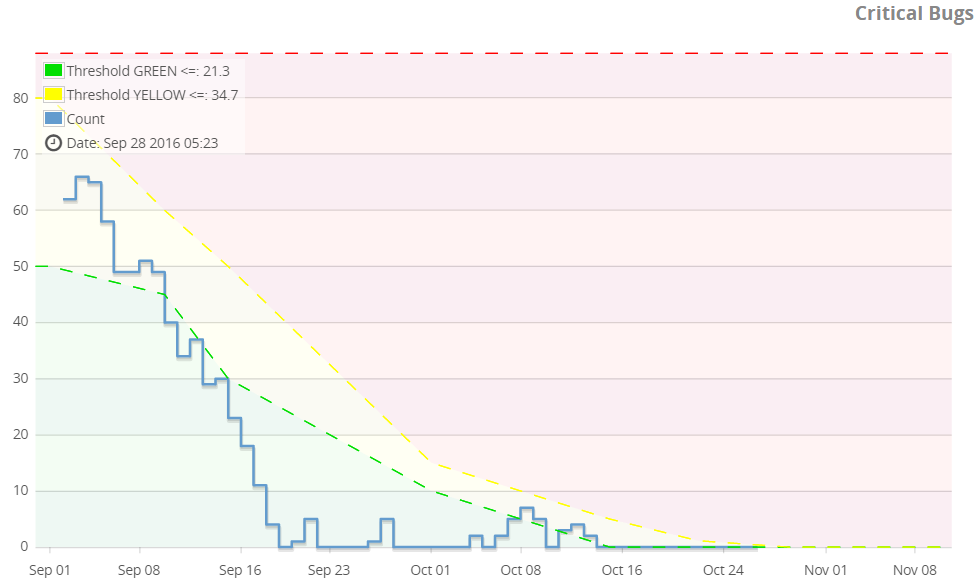
Figure 6: Metrics Trend Chart widget showing the trend of the »Critical Bugs« metric with dynamic thresholds
Summary
Issue metrics and threshold configurations are two powerful features of Teamscale. In this blog post, I showed you how you can combine them to get an overview of critical bugs in a project and chain them using thresholds.