-
 Blog
Blog
-
Evaluate Metrics using Thresholds

Teamscale computes a number of metrics for each analyzed project (lines of codes, clone coverage, comment completeness, …) and supports uploading further metrics from external systems (e.g. from the build server). The computed metrics are updated with every commit and provide an overview over the state of a software project. As it is sometimes hard to tell what is good and what is bad, the next Teamscale version will be equipped with a new powerful feature that provides an assessment of metric values based on (built-in or custom) threshold configurations. It will help the user interpret the values.
In this post, I will briefly explain the Metrics Table—one of the widgets that supports displaying assessed metric values—and show the necessary steps to configure and use thresholds.
Metrics Table
The Metrics Table widget provides an overview over the metrics of a software project. The following Metrics Table uses a threshold configuration that consists of two groups with two thresholds each:
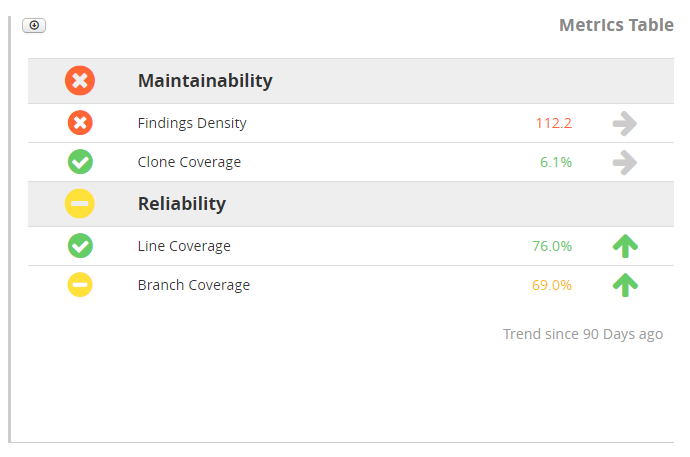
Rows with a gray background are groups that contain thresholds. The icon to the left of a group shows the aggregated assessment of all its thresholds and is either a green, yellow or red rating.
The rows of the thresholds below each group also have a rating icon at the left and present their assessment result. A click onto the assessment icon displays a tree map that shows the value for the different parts of the project. Next to the metric’s name, the widget shows the current value and an arrow to indicate whether the value improved or deteriored. A click onto the arrow icon displays the trend for the specified period of time.
Configuration
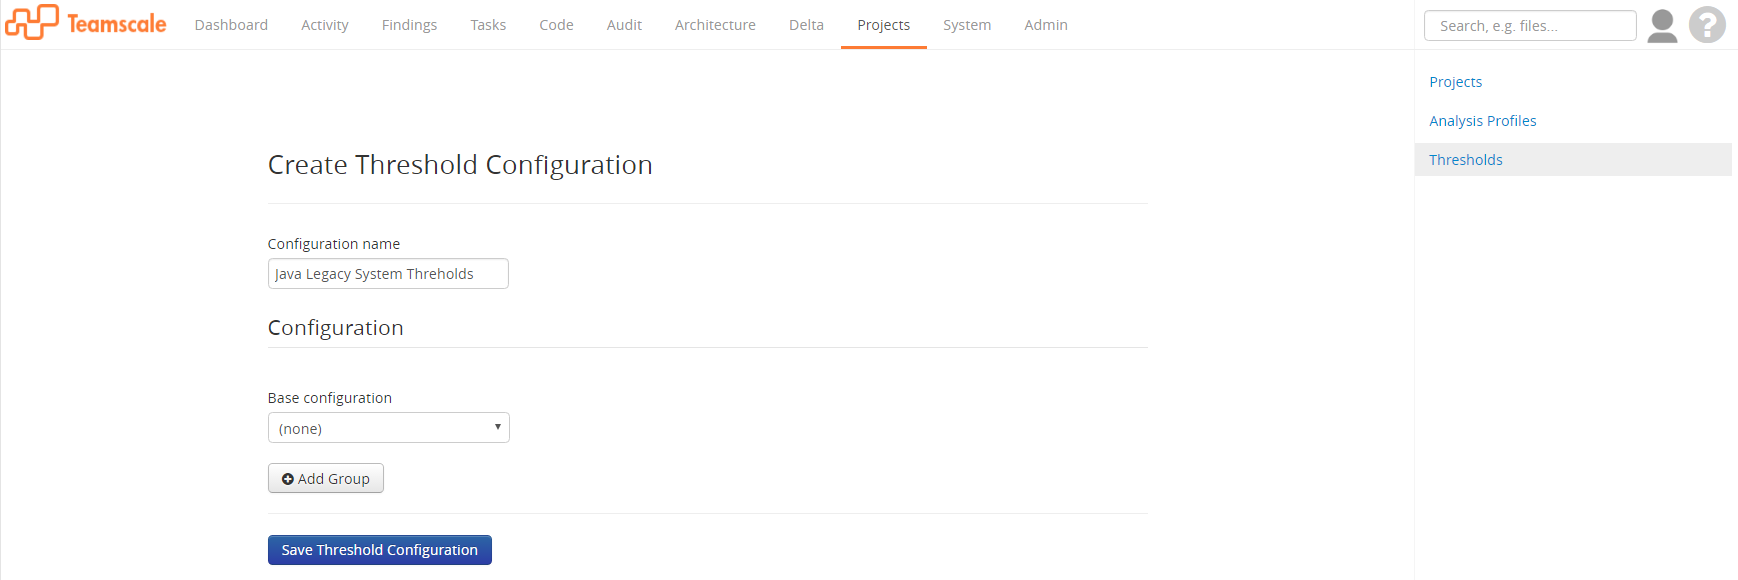
In order to create the Metrics Table with the presented content, we first need to create a threshold configuration to specify the metrics and threshold values. We can do that in the Projects perspective under the Thresholds view. A threshold configuration is identified by its name and consists of thresholds structured in groups. It is project-independent.
Let’s create a new configuration and call it »Java Legacy System Thresholds«, because our system at hand is an old Java system.
Now, let’s add a new group with name »Maintainability« and add the »Findings Density« metric to it.
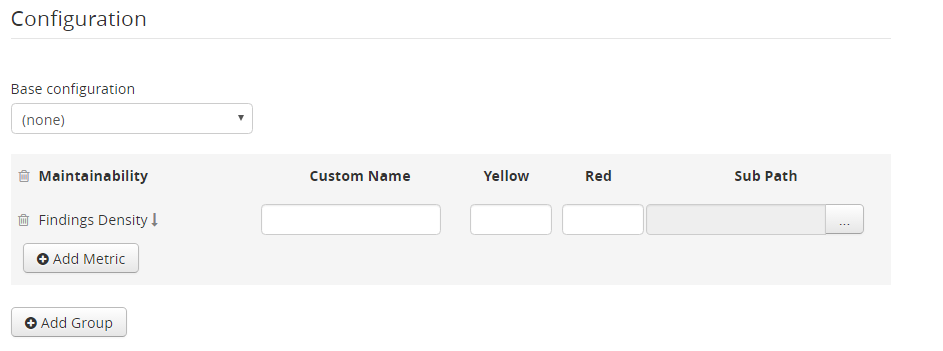
A new row will be created for the added »Findings Density« metric. The name of the metric is shown and the arrow next to it explains in what direction the metric is assessed. If the arrow points down, low values indicate good values and vice versa. The field »Custom Name« allows you to use another name than the metric’s name when displaying the row in the Metrics Table. Unless two rows with the same metric exist, the custom name is optional and the metric’s name will be displayed in case the custom name is not specified. The fields »Yellow« and »Red« allow you to specify thresholds. Depending on the metric, the fields can be either filled with an arbitrary numeric value or a percentage value (as number between 0 and 1). It is also possible to specify only one of the thresholds or none (in order to just display the value in the Metrics Table). Note that some metrics are not supposed to be assessed (such as »Lines of Code«); it is not possible to specify thresholds for those. The field »Sub Path« allows restricting the assessment and validity of the thresholds to a certain part of a project. It can be used to assess different parts of a project differently (e.g. restrict the threshold to the production code by excluding test code). It is also possible to use a path that points to an architecture component.
Let’s also add the »Clone Coverage« to the »Maintainability« group and create a new group »Reliability« for the metrics »Line Coverage« and »Branch Coverage« with the desired threshold values. Then, let’s save the configuration and go back to the Dashboard perspective.
We will create a new dashboard and add the Metrics Table widget to it.
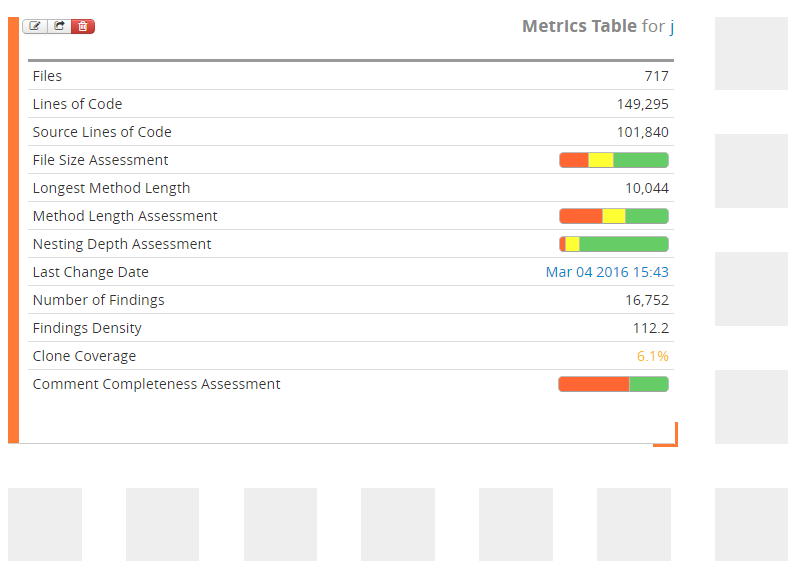
Initially, the widgets shows the metrics of a default configuration. Therefore, let’s edit the widget settings to use our newly created configuration and enable the assessments.
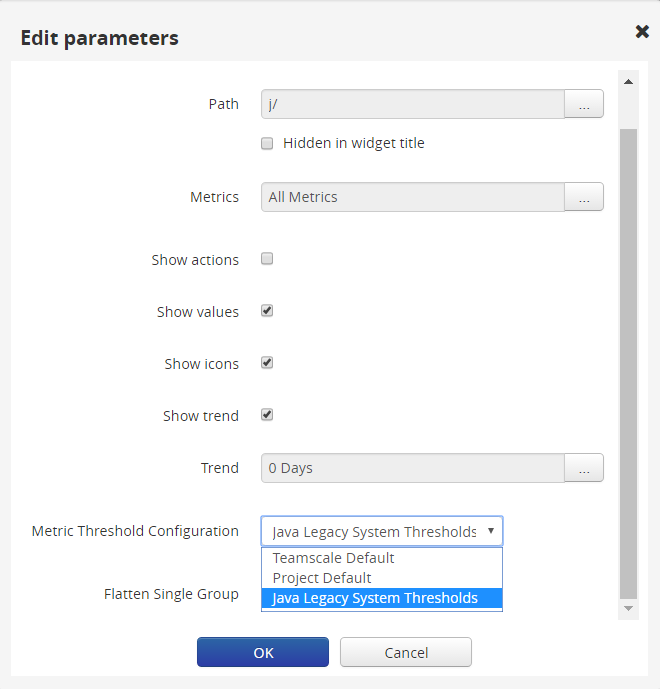
The field »Metric Threshold Configuration« specifies the used configuration. It is possible to select the built-in »Teamscale Default«, the »Project Default« configuration and any configuration created by the user. Let’s select our previously created »Java Legacy System Thresholds«. Furthermore, let’s activate »Show icons« to display an icon showing the assessment and »Show trend« to allow viewing the metric’s history. After applying the changes, the widget shows our thresholds.
Besides the Metrics Table Widget, the thresholds can also be plotted in the Metrics Trend Chart and the Metrics Bar Chart widget.
To sum up, Teamscale’s threshold configurations are useful means to specify thresholds globally and use them consistently in dashboards. They allow assessing and comparing different projects with the same threshold rules. In a further blog post I will explain advanced configuration settings such as configuration inheritance, time-dependent configurations with linear transitions, and the use of non-code metrics.