-
 Blog
Blog
-
Issue Metrics with Teamscale

Today, I would like to focus on an exciting new feature we added to Teamscale with the latest version: issue metrics. While Teamscale could connect to your issue tracker (such as Jira or Redmine) and link commits to individual issues already, this new feature provides deeper insights into your existing issue data.
Issue Queries
Teamscale now provides a new perspective called Issues, where you can search the issues stored in the database using a rich query language. For example, to find all open critical bug tickets on our own code base, you could use a query like the following:
closed = false && Tracker=Bug && Priority in [Urgent, Immediate]
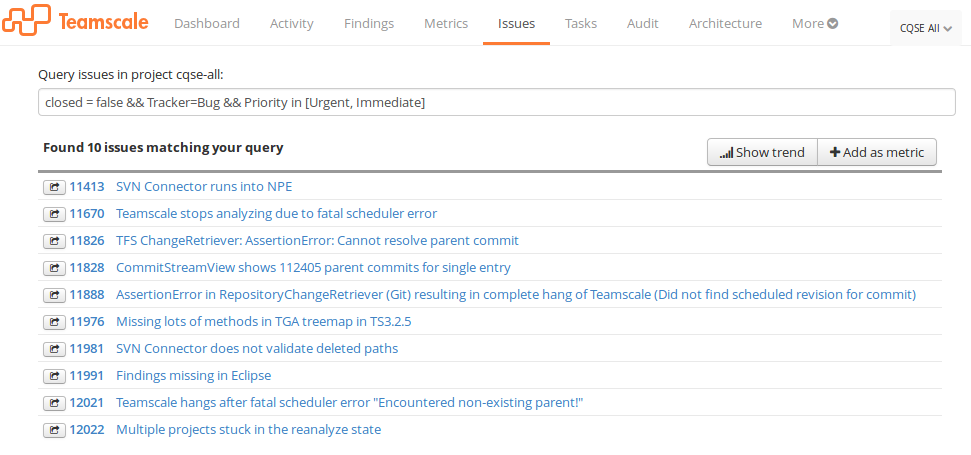
While most issue trackers allow these kinds of queries, we consider the changes in the ticket’s state over time as very important. For example, fixing urgent bugs quickly is probably a priority for you. So you would like to focus not simply on open critical bugs, but only those that are in the state open for at least one week, which changes our query as follows:
closed = false && Tracker=Bug && Priority in [Urgent, Immediate] && inState(closed=false) > 7

The inState construct allows you to use any subexpression, so you can check for any condition, like review, testing or reaction times, to hold for a specific duration. For a full reference on our query language check section 4.1.6 of our Teamscale User Guide.
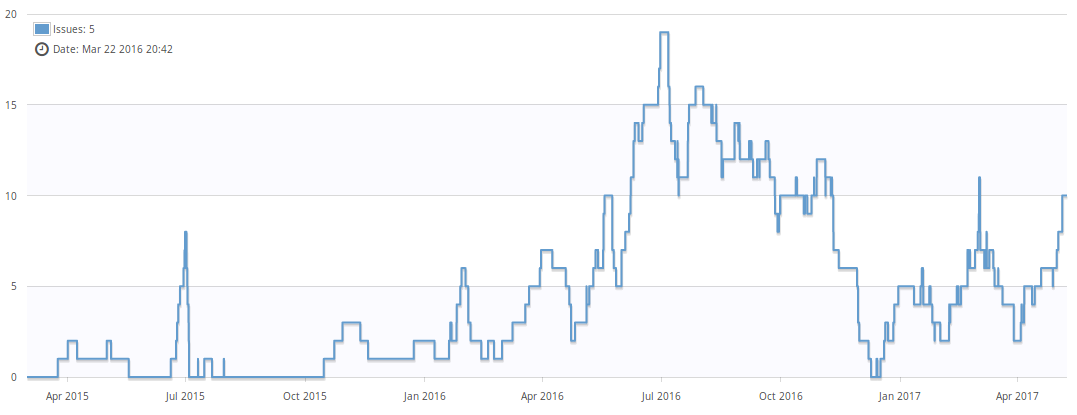
Full History
One of Teamscale’s unique features is the full history support for your version control system. This allows you to extract historical information and trend data even when setting up a new Teamscale instance. The same is true for our issue queries. We extract the entire change history for all tickets and allow you to query trends in real time, so you can learn from past events and track success or your process changes. The following chart shows the history for the previous query.
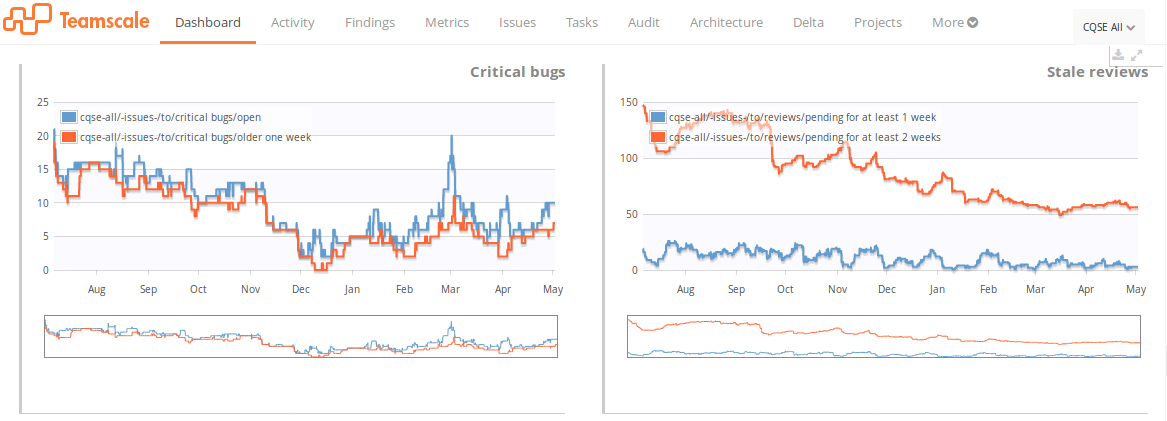
Metrics and Dashboards
Teamscale already provides a wealth of metrics and dashboard visualizations to help you better visualize the state and evolution of your software development project. So it is only natural to integrate the issue queries with the existing visualizations. Teamscale allows you to define arbitrary issue queries as metrics, to visualize their current status and track their change over time. With our dashboards you can define and share a set of visualizations you want to access easily and often.
Upcoming
We are still exploring the full potential of these queries. Besides the shown examples, you can also check opening and closing rates of tickets (or any subset of tickets), or check for tickets in an invalid state.
Additionally, we plan to integrate the issue data deeper in the existing Teamscale features. For example, we want to plot treemaps of code affected by selected tickets. With the right queries, this allows you to spot the most error-prone parts of your system. If test execution data is available, we could also show you the test gaps for the selected issues. These features are all scheduled to be integrated within the next few releases.
What is your opinion about integrating issue data with your quality control process? Do you have more exciting ideas of how to use this data? Let us know in the comments!