-
 Blog
Blog
-
How Much of Your Code Do You Actually Use?

When talking to customers about improving the quality of their code, one question that always comes up is where to start. And, as always in the software industry, the answer is »It depends«. We have already covered this topic on this blog in the past (e.g., here, here). This time, I would like to add another dimension to the question, namely the actual usage of code in production.
There are several techniques to categorize and prioritize quality defects found by static analyses. What they all have in common is that they try to maximize the return on investment (ROI), i.e., weigh the cost of an improvement against its benefit. For a detailed discussion on these strategies, see my colleague Daniela’s PhD thesis or one of the posts linked above. For this post, I will give only a rough overview of criteria that can steer the decision process.
- Severity
- Fix the most severe issues first, e.g., things that lead to crashes when the respective code is executed.
- Recency
- Fix the most recently introduced issues first. This minimizes the cost, since the developers still remember the code and can understand it faster.
- Boy Scout Rule
- Similar to the previous one, but also fix issues in code that you change anyway, leaving the code cleaner than you found it.
All of the points mentioned above have one thing in common: If the code is never actually used in production, the ROI of fixing any defects will be zero. Therefore, we are regularly asked whether we can provide some insight into code usage as well. In the remainder of this post, I give an overview over what you can achieve today using our recently announced support for Test Gap Analysis (TGA) in Teamscale as well as a brief outlook.
What is Possible Today
When selecting profiling tools to use for TGA, one of our key requirements was that the profiler has very little to no performance impact. For ABAP-based systems, we therefore use SAP’s Usage Procedure Logging (UPL), while for Microsoft’s .NET platform, we developed our own lightweight profiler. After years of using these tools on test systems, we were confident they can safely be used on productive systems as well, providing insight into the actual code usage rather than test execution.
The first step towards usage analysis was therefore to simply move TGA from the test system to the productive one. While the actual analysis is exactly the same as for TGA, the results have different meanings. I will illustrate this using the execution view and the change coverage view:
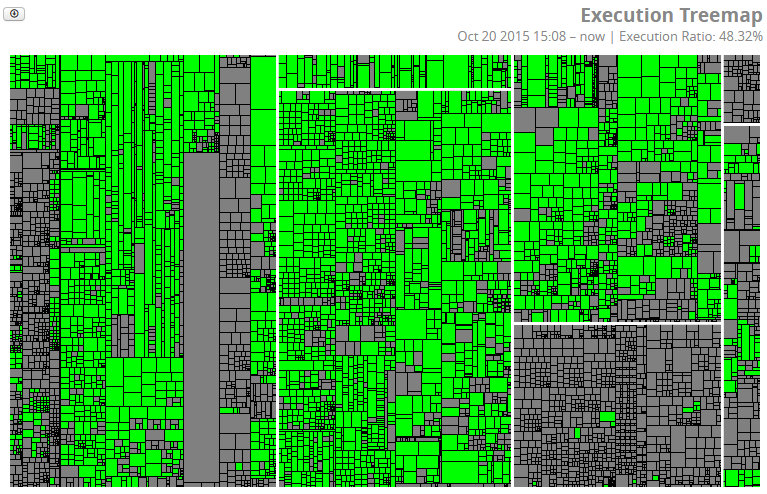
Figure 1: Execution View
As described in previousTGAposts, gray boxes represent methods that have not been executed, while green ones have been. On a test system, this shows how well the monitored tests cover a system, e.g., to give you an indication about the broadness of your regression test suite. In the productive system, you see which code has actually been executed. To be clear: I don’t say you should not have gray boxes. There has to be code for which not being executed is perfectly fine, e.g., error handling code. And there is also code that may run only once a year, maybe for archiving purposes or certain year-end functions. But, as in TGA, large areas of gray should trigger questions that lead to conscious decisions—here particularly »Do we still need this code?«
The following figure is what we call the Test Gap view in TGA. And, as you will see, this also translates nicely into the realm of a productive system.
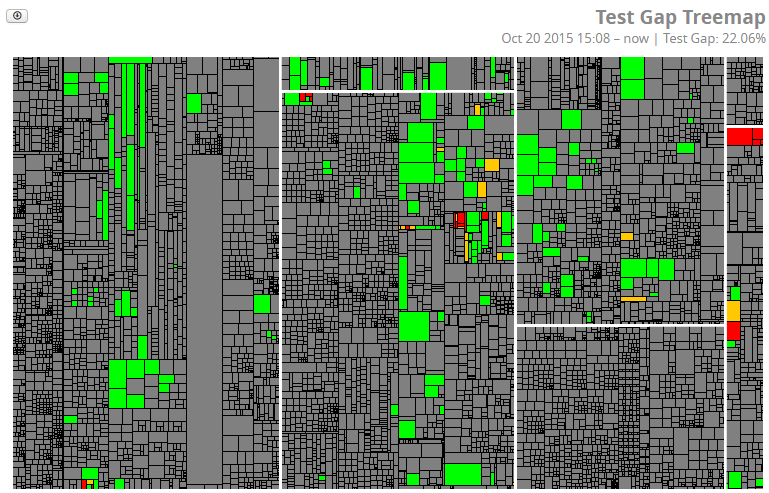
Figure 2: Change Coverage View
Here, gray means that a method has not been changed since the last release. Green means it has been changed and was executed afterwards (which should be the expected pattern). Red and orange boxes show methods that have been added or changed, respectively, but were not executed afterwards. On a test system this indicates a missing test case. On the productive system, however, this may indicate a feature that has been requested, specified, implemented, tested, and shipped, but never actually used. So if anybody were to ask for changes to this feature, you can present a pretty solid reason why spending money on that may not be a good idea.
Upcoming additions
When showing our customers results of this analysis on their own systems, the immediate question was »Can I see how often a method was executed?« Since some of the profilers not only register method executions but also count them, we can include this information in our analysis.
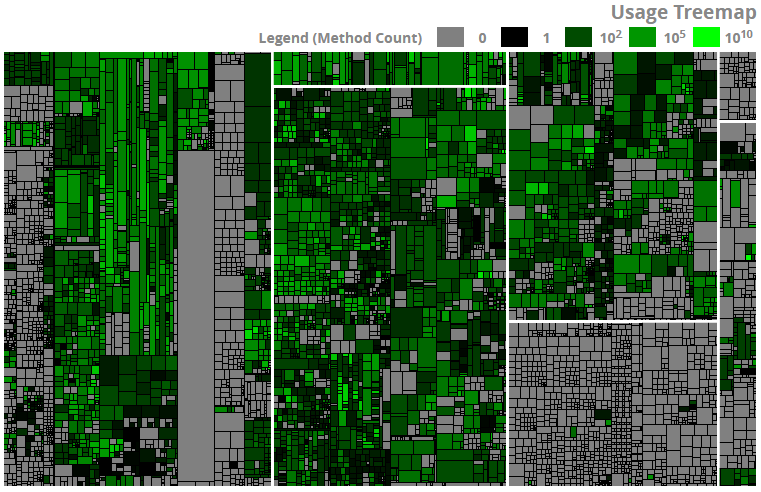
Figure 3: Usage View
In this figure, gray sill means no execution, while rarely executed methods appear in dark green, and more frequently executed ones are shown in lighter shades. Note that execution counts vary from a single method call to several billions, which is why the above figure uses a logarithmic scale. This feature will be available for SAP ABAP systems in the upcoming Teamscale version 2.1.
In summary, the execution count can be another factor that you can take into account the next time you ask yourself »Where should I start cleaning up?«.