-
 Blog
Blog
-
Delta Analysis with Teamscale

If you are controlling software quality in a continuous manner, the absolute values of the quality measures at a specific point in time are often not the most important thing. What matters more, is the direction in which you are going. While there may be short-term decreases in quality over time, e.g. due to larger refactorings, the general trend should be towards improvement. An effective way to determine this trend is a Delta Analysis.
A Delta Analysis compares two snapshots of the code base and determines how the changes in the time frame affected the software quality. To do this correctly, a tool has to be able to differentiate between old and new quality deficits (we call them findings). Many existing tools have major limitations in their tracking of findings. For instance, renaming a class or moving a method from one class to another will usually result in all findings being reported as new. In contrast, Teamscale’s sophisticated findings tracking can deal with these scenarios, that happen on a regular basis in real-world software projects.
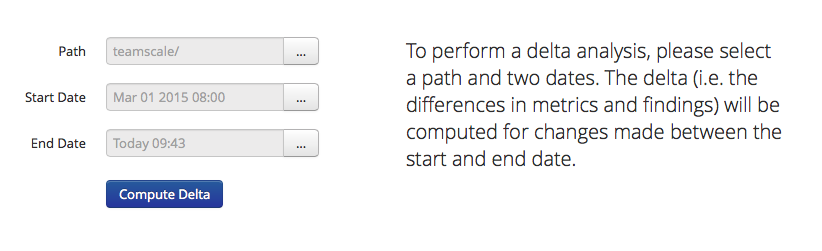
The Delta Analysis in Teamscale begins with defining a start and end date. You may optionally specify a sub-path of your code base to focus e.g. on a specific sub module.
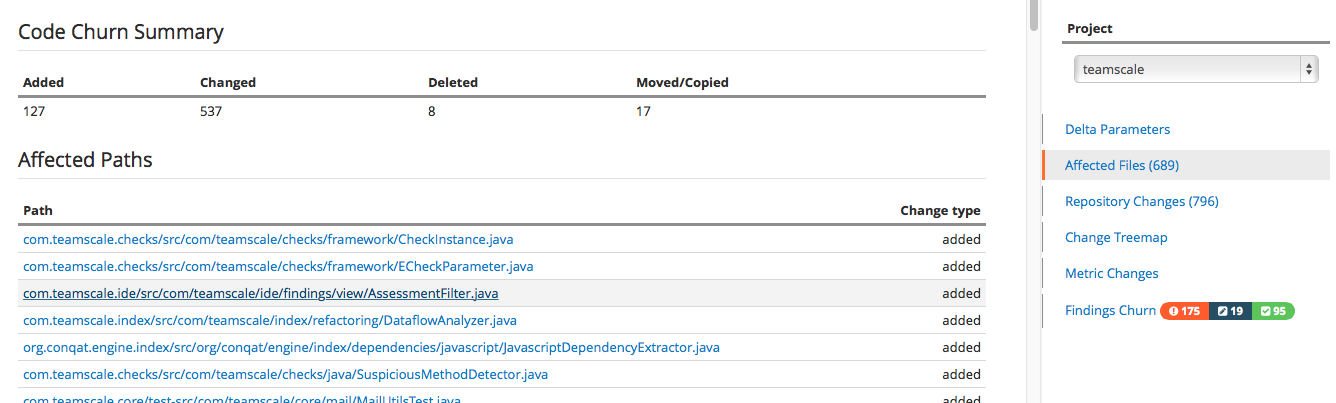
Teamscale will then first show you the files affected by commits in the time frame, reporting the files added, changed, deleted or moved/copied. You can inspect the list of files including a side-by-side diff for edited files. This gives you a first overview of the development actitivies within the analyzed time period.
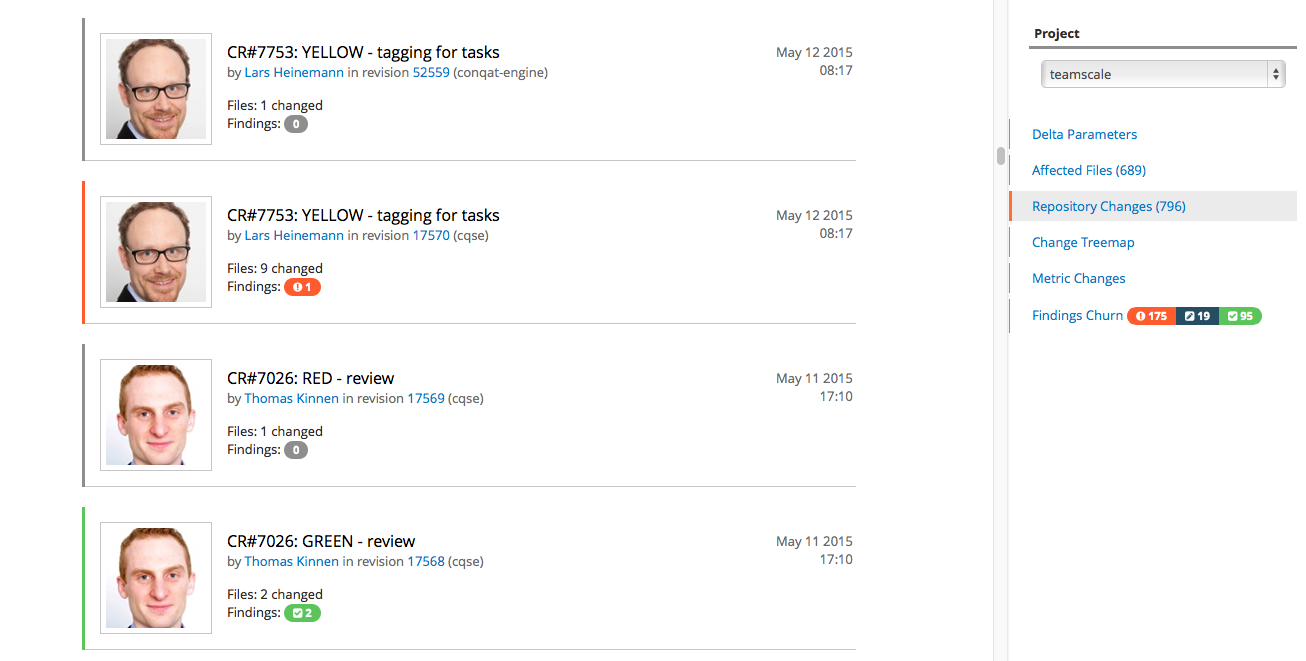
The Repository Changes tab shows you the list of commits in the time frame along with their individual finding churns (i.e., added findings, removed findings, findings in changed code). The annotated repository changes help you to see how the indivudual commits affected the quality in the time period.
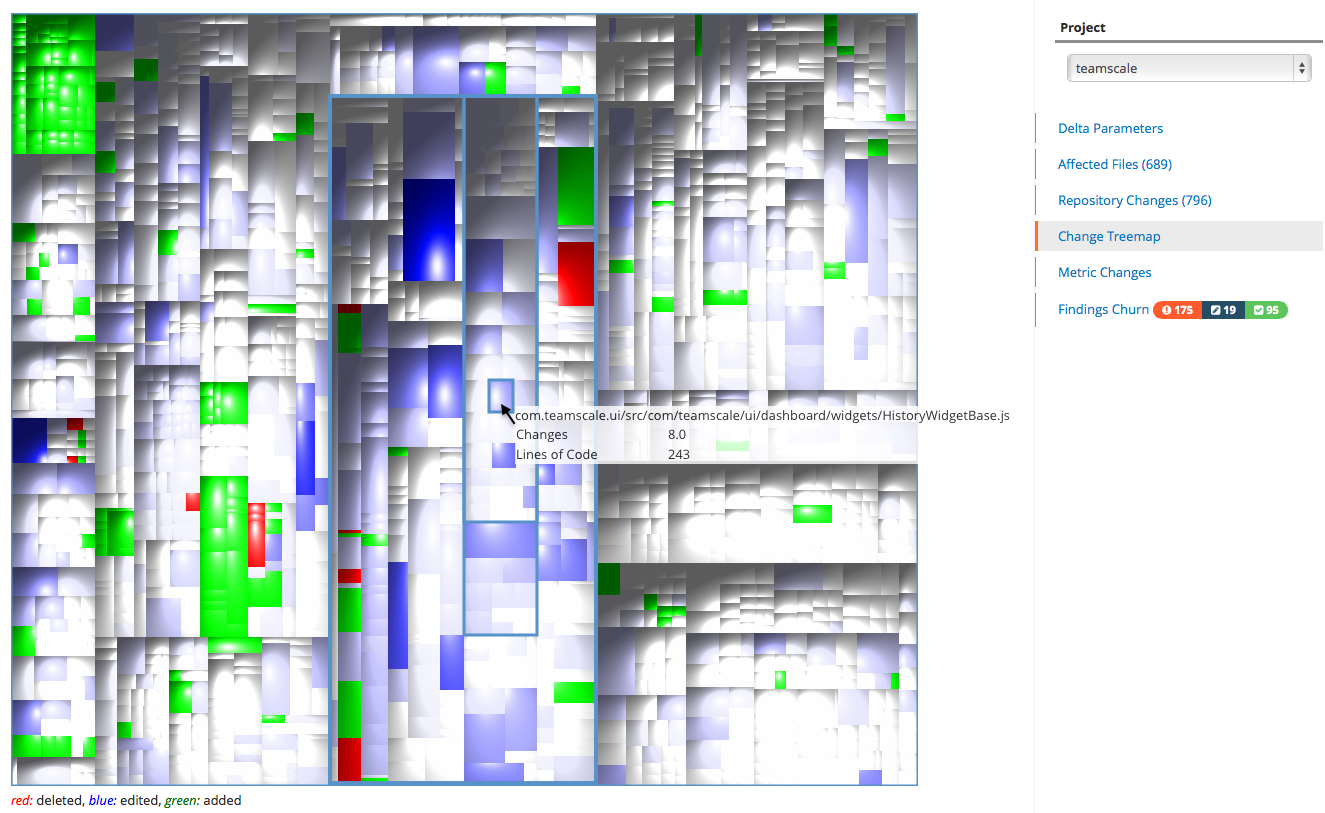
The Change Treemap shows you a treemap of the changes. In this visualization, each file in the code base is shown as a rectangle whose area corresponds to the file size in lines of code. With the Change Treemap, you can see at a glance where in your code base files were deleted (red), edited (blue), or added (green). Tooltips allow identifying individual files. This information helps you putting the changes of quality metrics into perspective. As an example, the quality may improve by deleting a lot of bad code.
The Metric Changes tab aggregates the changes and shows how they affected the quality metrics measured by Teamscale. For each metric, you can inspect if the quality increased or decreased in the analyzed time frame. 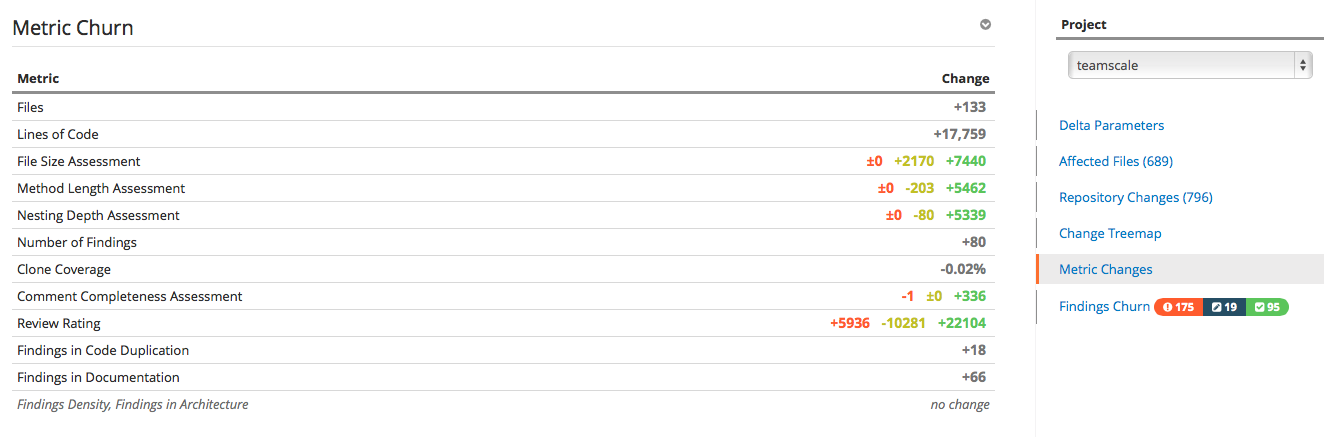
Finally, the Findings Churn tab shows a detailed list of findings that were added or removed or were located in code changed in the time frame. The findings churn tab is especially useful for a continuous quality control process. It reports at a glance the findings that should have been addressed during development. Usually, the quality engineer will create task from them to be addressed in the next iteration. 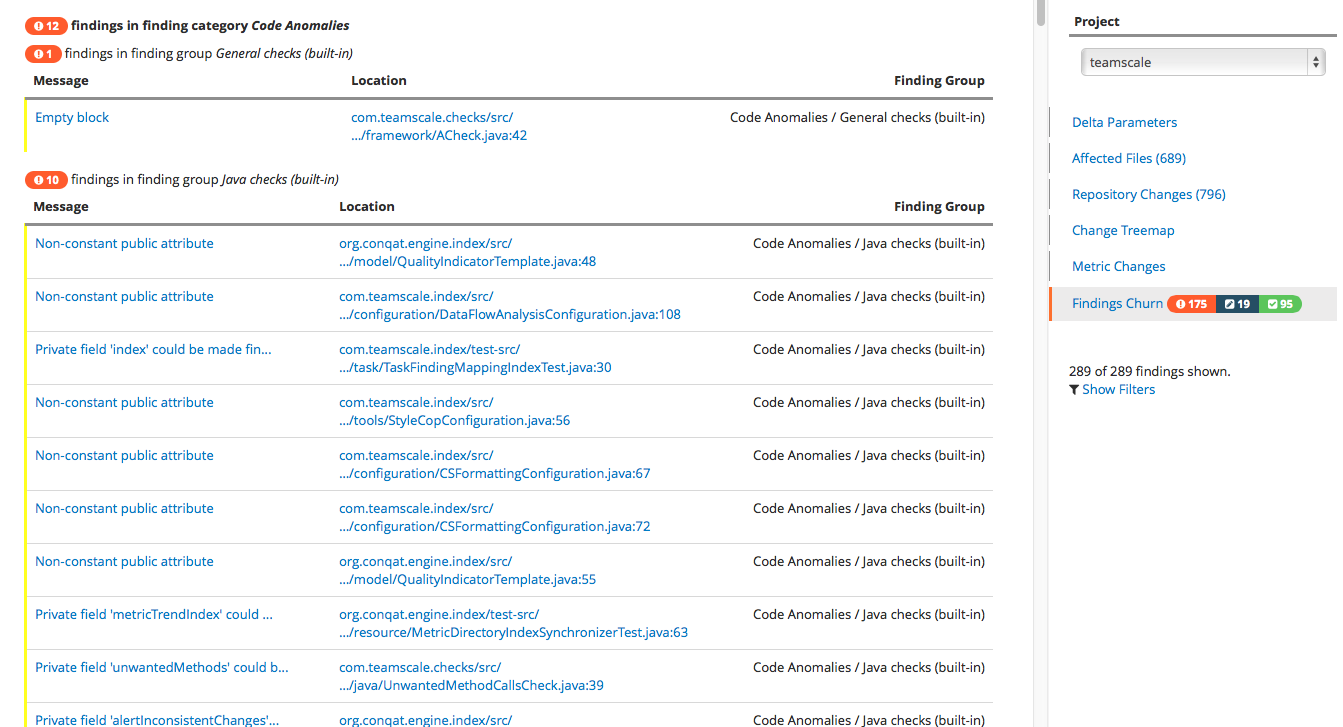
In conclusion, Teamsale’s Delta Analysis helps you to focus on the most relevant findings which is an essential part of effective continuous quality control for long-living software systems.
Want to learn more about Teamscale or try it yourself? Check out the Teamscale website